The Challenge
Sarah had been investing in residential condominiums for a decade. Like many Malaysian property investors of her generation, she followed the conventional playbook: buy off-plan or subsale condos in KL, Bangsar, or Mont Kiara, rent them out, and wait for capital appreciation.
By 2022, that playbook was no longer working. Here is the actual performance of Sarah's residential portfolio:
Sarah's Residential Portfolio (2022)
| Property | Location | Purchase Price | Current Value (2022) | Monthly Rental | Gross Yield | Net Yield (After Fees) | Annual Appreciation (5yr avg.) | Vacancy (Last 12 Months) |
|---|---|---|---|---|---|---|---|---|
| Condo A | Bangsar South | RM780,000 (2016) | RM810,000 | RM2,400 | 3.56% | 2.8% | 0.8% | 2 months vacant |
| Condo B | Mont Kiara | RM920,000 (2018) | RM880,000 | RM2,800 | 3.82% | 3.0% | -0.9% (capital loss) | 1 month vacant |
| Condo C | Cheras | RM480,000 (2017) | RM510,000 | RM1,500 | 3.53% | 2.6% | 1.2% | 3 months vacant |
| Portfolio Total | RM2,180,000 | RM2,200,000 | RM6,700 | 3.65% | 2.8% | 0.15% | Avg. 2 months/year |
The numbers told a clear story:
- Gross yields averaging 3.65% — barely above the fixed deposit rate and well below her mortgage interest of 4.1%
- Net yields of 2.8% after maintenance fees (RM300–800/month per unit), sinking fund, assessment, and agent commissions on tenant turnover
- Near-zero capital appreciation across the portfolio — Mont Kiara was actually underwater
- Persistent vacancy — an average of 2 months per year per unit, during which she was still paying maintenance fees and mortgage instalments
- High management effort — dealing with three different management corporations, tenant complaints about aircon repairs, leaking ceilings, and furniture damage
Sarah's residential portfolio was generating a total net return of approximately 3% — after a decade of effort, capital commitment, and management headaches. A fixed deposit would have delivered similar returns with zero effort.
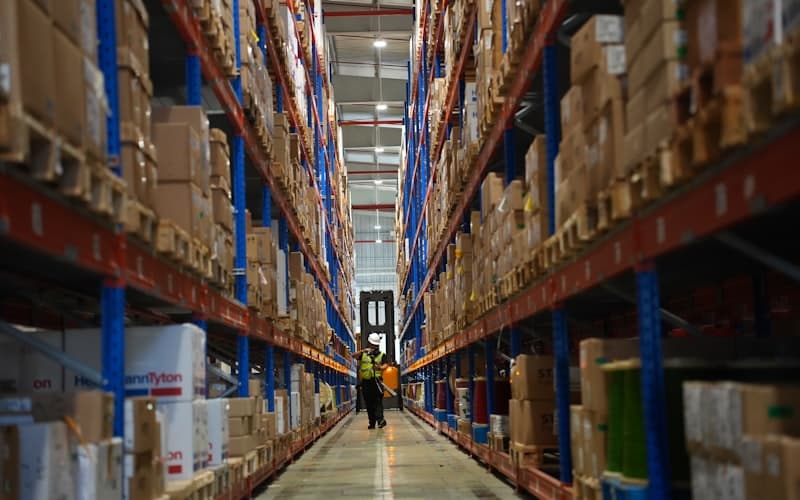
A business contact — a factory owner in Shah Alam — mentioned industrial property: "My landlord collects RM9,500 a month from me and doesn't even visit the property. No maintenance fees, no aircon to fix, no tenant furniture to replace." That conversation planted a seed.
Sarah searched online for "industrial property investment Malaysia" and found pages of listings but no guidance. What makes a good industrial investment? Which areas are growing? What do tenants look for? The portals offered properties but no advisory context. Sarah did not need another listing — she needed someone who understood industrial fundamentals.
Industrial vs Residential Investment
When Sarah contacted IndustrialKL, our advisor started with education, not listings. We walked through the fundamental structural differences between residential and industrial property investment.
| Factor | Residential (Condo) | Industrial (Factory/Warehouse) |
|---|---|---|
| Gross rental yield | 2.5–4.0% (KL average) | 5.0–7.0% (Greater KL average) |
| Net rental yield | 1.5–3.0% (after maintenance, sinking fund, agent fees) | 4.5–6.5% (minimal deductions — tenant bears most costs) |
| Typical lease length | 1 year (often month-to-month) | 3–5 years (with options to renew) |
| Tenant stability | Low — tenants move frequently, especially expats | High — businesses relocate rarely due to operational disruption |
| Maintenance cost to landlord | High — aircon, water heaters, furniture, painting between tenants | Low — tenant is responsible for internal maintenance under triple-net |
| Vacancy risk | Moderate-High — KL condo oversupply, 30%+ vacancy in some areas | Low — Greater KL industrial vacancy at 2.0% (Q2 2025) |
| Management effort | High — tenant complaints, repairs, utility disputes, furnishing | Low — professional tenants, self-managing, minimal landlord involvement |
| Entry price (Greater KL) | RM400,000–1,500,000 per unit | RM800,000–5,000,000 per unit |
| Capital appreciation (5yr avg.) | 0–3% annually (KL condos, post-cooling measures) | 5–8% annually (Greater KL industrial, 2019–2024) |
| Tenant improvement | Tenant adds no value — often causes wear and tear | Tenant often improves the property (electrical upgrades, flooring, fit-out) |
| Financing | 90% LTV available, but RPGT and LTV limits for 3rd property | 80% LTV typical for industrial; some banks unfamiliar with segment |
| Oversupply risk | High — 83,000+ unsold residential units in KL/Selangor (NAPIC 2024) | Low — limited new supply, especially in established areas |
The yield gap was stark: Sarah's condos were returning 2.8% net, while industrial property in Greater KL was delivering 4.5–6.5% net — a premium of 1.7 to 3.7 percentage points. On a RM1.85M investment, that difference translates to RM31,000–68,000 per year in additional income.
But yield was only part of the story. The structural advantages — longer leases, lower vacancy, lower maintenance, and tenant-funded improvements — meant that industrial property was not just higher-returning but also lower-effort. Sarah would spend less time managing one factory than she currently spent managing three condos.
Area Investment Analysis
Our advisor provided a focused analysis of three areas in Greater KL where we saw the strongest investment fundamentals for Sarah's budget (RM1.5M–2.5M) and risk profile (moderate, first-time industrial investor):
| Factor | Jenjarom | Shah Alam Section 23 | Telok Panglima Garang (TPG) |
|---|---|---|---|
| Typical price (5,000 sqft factory) | RM1.0M–1.8M | RM1.5M–2.5M | RM0.9M–1.5M |
| Price per sqft (built-up) | RM200–360 | RM300–500 | RM180–300 |
| Gross rental yield | 5.5–6.5% | 5.0–6.0% | 5.5–7.0% |
| Tenant demand | Growing — SMEs relocating from Puchong/PJ/Shah Alam | Strong — established industrial ecosystem, blue-chip tenants | Moderate — concentrated in FTZ (MNC) and newer parks |
| Vacancy rate | 8–12% (new supply absorbing) | 3–5% (tight market) | 10–15% (outside FTZ) |
| Infrastructure maturity | Developing — SKVE access, limited rail, improving utilities | Mature — 7 expressways, KTM, LRT3 (2026), full utilities | Moderate — SKVE access, FTZ well-served, surrounding areas developing |
| Tenant quality | SMEs, some MNCs in newer parks | MNCs + established Malaysian companies | MNCs in FTZ (Renesas, Amkor); SMEs elsewhere |
| Capital appreciation (3yr projected) | 15–25% (emerging corridor discount narrowing) | 15–20% (steady, infrastructure-driven) | 10–18% (dependent on Carey Island port timeline) |
| Flood risk | Moderate (site-specific — elevated parks are safer) | Low (Section 23 on higher ground) | Moderate-High (areas near Sungai Langat) |
| Exit liquidity | Moderate — growing buyer interest but thinner market | High — most liquid industrial sub-market in Greater KL | Low-Moderate — smaller buyer pool |
| Risk level | Moderate — price appreciation tied to infrastructure delivery | Low-Moderate — established market with track record | Moderate-High — more speculative, longer horizon |
| Best for | Growth-oriented investors seeking higher appreciation | Conservative investors seeking stable yield + liquidity | Value investors with longer time horizons |
Based on Sarah's budget of RM2M and preference for moderate risk with proven fundamentals, our advisor focused the search on Shah Alam Section 23. The rationale was clear:
- Lowest vacancy in the comparison — tenants are readily available
- Highest exit liquidity — if Sarah needed to sell, Shah Alam factories trade frequently with an established buyer market
- Proven appreciation track record — Section 23 has delivered consistent 5–8% annual capital growth over the past decade
- Infrastructure is already in place — no waiting for highways or utilities to be built
- LRT3 opening in 2026 will further enhance labour access and property values
Jenjarom would have offered higher potential appreciation but carried more uncertainty. TPG's lower entry price was attractive but the exit market was thinner. For a first-time industrial investor, Shah Alam Section 23 was the right starting point.
The Property
Our advisor identified a 5,000 sqft single-storey detached factory in Shah Alam Section 23 that met all of Sarah's investment criteria.
Property Specifications
| Specification | Detail |
|---|---|
| Type | Single-storey detached factory |
| Built-up area | 5,000 sqft |
| Land area | 6,200 sqft (freehold) |
| Ceiling height | 7.5m (25 ft) clear |
| Power supply | 200A three-phase |
| Floor load | 15 kN/m² |
| Loading | 1 ground-level roller shutter (14 ft), 1 side access door |
| Office | Mezzanine office, 600 sqft, with attached toilet |
| Condition | Good — previous tenant (CNC machining) maintained the unit well |
| Parking | 4 car parks + container truck turning radius |
| Tenure | Freehold |
| Zoning | Light/medium industrial |
| Asking price | RM1.95M |
| Negotiated price | RM1.85M |
| Discount obtained | 5.1% |
Comparable Transaction Data (Shah Alam Section 23, 2022)
To validate the purchase price, our advisor compiled recent transaction data for comparable properties in the same section:
| Transaction | Size (sqft) | Price (RM) | Price/sqft | Date |
|---|---|---|---|---|
| Lot 12, Jalan Danau | 5,200 | RM1.90M | RM365 | March 2022 |
| Lot 7, Jalan Pelabur | 4,800 | RM1.78M | RM371 | January 2022 |
| Lot 23, Jalan Industri | 5,500 | RM2.15M | RM391 | May 2022 |
| Lot 31, Jalan Pahat | 5,000 | RM1.88M | RM376 | April 2022 |
| Sarah's purchase | 5,000 | RM1.85M | RM370 | July 2022 |
| Section 23 average (2022) | RM376 |
Sarah's purchase price of RM370/sqft was slightly below the Section 23 average, confirming good value. The 5.1% discount from asking price was achieved through a clean offer with minimal conditions and a 30-day settlement timeline — demonstrating the advantage of being an informed buyer with pre-arranged financing.
Financial Analysis
Purchase Cost Breakdown
| Item | Amount (RM) |
|---|---|
| Purchase price | 1,850,000 |
| Stamp duty (MOT) — 1% on first RM100K + 2% on next RM400K + 3% on next RM500K + 4% on remaining RM850K | 57,000 |
| Legal fees (S&P + loan documentation) | 28,500 |
| Valuation fee | 4,500 |
| Renovation (minor — repainting, new roller shutter motor) | 18,000 |
| Total acquisition cost | RM1,958,000 |
Rental Income Analysis
Within two weeks of completion, our advisor introduced a tenant — a precision engineering company specialising in CNC machining and jig fabrication for the automotive sector. The tenant had been searching for a unit in Section 23 for three months and was ready to sign immediately.
| Rental Metric | Detail |
|---|---|
| Monthly rental | RM9,500 |
| Annual rental income | RM114,000 |
| Lease term | 3 years (with option for 3-year renewal at 10% increase) |
| Deposit | 2 months rental + 1 month utility = RM28,500 |
| Lease type | Modified triple-net (tenant bears internal maintenance, minor repairs, insurance) |
| Rent escalation | Fixed for 3 years; 10% increase on renewal |
Yield Calculation
| Yield Metric | Calculation | Result |
|---|---|---|
| Gross rental yield | RM114,000 / RM1,850,000 | 6.16% |
| Less: Assessment tax (MBSA) | ~RM5,400/year | |
| Less: Quit rent | ~RM1,200/year | |
| Less: Building insurance | ~RM2,800/year | |
| Less: Minor common area maintenance | ~RM1,800/year (external painting reserve, drain clearing) | |
| Total annual expenses | RM11,200 | |
| Net rental income | RM114,000 - RM11,200 | RM102,800 |
| Net rental yield | RM102,800 / RM1,850,000 | 5.56% |
| Net yield on total cost | RM102,800 / RM1,958,000 | 5.25% |
Compare this to Sarah's residential portfolio net yield of 2.8%. The industrial property delivered nearly double the net return — with less management effort.
3-Year Capital Appreciation
Three years after purchase, in mid-2025, comparable units in Shah Alam Section 23 were transacting at materially higher prices:
| Transaction | Size (sqft) | Price (RM) | Price/sqft | Date |
|---|---|---|---|---|
| Lot 9, Jalan Danau | 5,100 | RM2.45M | RM480 | February 2025 |
| Lot 15, Jalan Pelabur | 4,900 | RM2.32M | RM473 | March 2025 |
| Lot 28, Jalan Industri | 5,300 | RM2.58M | RM487 | January 2025 |
| Lot 5, Jalan Pahat | 5,000 | RM2.40M | RM480 | April 2025 |
| Section 23 average (2025) | RM480 |
| Appreciation Metric | Value |
|---|---|
| Purchase price (2022) | RM1,850,000 |
| Estimated current market value (2025) | RM2,400,000 |
| Capital gain | RM550,000 |
| Capital appreciation | 29.7% |
| Annualised appreciation | 9.1% |
The 30% appreciation was driven by several converging factors:
- LRT3 completion approaching (mid-2026) — increasing accessibility and property values across Shah Alam
- Industrial vacancy compressing from 4.8% (Q4 2024) to 2.0% (Q2 2025) — supply scarcity driving prices
- Institutional investment surge — Maersk, LOGOS/SAILH, and other major logistics investments validating Shah Alam as a premium industrial location
- Rental growth of 8–10% in Sections 22, 23, 26, and 33 during 2025 — supporting higher capitalisation rates
The tenant also renewed for a second 3-year term at a 10% rental increase (RM10,450/month), pushing the gross yield on original purchase price to 6.78%.
Portfolio Comparison: 3 Years Later
The contrast between Sarah's residential investments and her industrial investment after three years is definitive:
| Metric | Condo A (Bangsar South) | Condo B (Mont Kiara) | Condo C (Cheras) | Factory (Shah Alam Sec 23) |
|---|---|---|---|---|
| Purchase price | RM780,000 | RM920,000 | RM480,000 | RM1,850,000 |
| Current value (2025) | RM830,000 | RM870,000 | RM530,000 | RM2,400,000 |
| Capital gain/loss | +RM50,000 (+6.4%) | -RM50,000 (-5.4%) | +RM50,000 (+10.4%) | +RM550,000 (+29.7%) |
| 3-year annualised appreciation | 2.1% | -1.8% | 3.3% | 9.1% |
| Monthly rental (2025) | RM2,500 | RM2,700 | RM1,600 | RM10,450 |
| Gross yield (on purchase price) | 3.85% | 3.52% | 4.00% | 6.78% |
| Net yield (on purchase price) | 2.9% | 2.6% | 2.8% | 5.56% |
| Vacancy (3-year average) | 1.5 months/year | 2.5 months/year | 2 months/year | 0 months (continuous tenancy) |
| Management effort | High (tenant turnover, repairs) | High (expat tenants, maintenance claims) | Moderate (stable tenant, older building) | Low (professional tenant, self-managing) |
| Maintenance fees paid by owner | RM350/month | RM780/month | RM280/month | RM0 (no strata) |
| 3-year total net income | RM82,440 | RM63,360 | RM46,800 | RM308,400 |
| 3-year total return (income + capital) | RM132,440 (17.0%) | RM13,360 (1.5%) | RM96,800 (20.2%) | RM858,400 (46.4%) |
The factory delivered a 3-year total return of 46.4% — outperforming every residential unit in Sarah's portfolio by a wide margin. The single factory generated more net income in three years (RM308,400) than all three condos combined (RM192,600).
Shah Alam Industrial Investment Outlook
Sarah's experience is not an anomaly. Shah Alam Section 23 continues to perform because of structural fundamentals, not speculation:
Demand drivers remain strong. Greater KL industrial vacancy has compressed to 2.0% (Q2 2025, JLL) — the tightest on record. E-commerce fulfilment, logistics modernisation, and manufacturing reshoring (China+1) are generating sustained tenant demand. Shah Alam's proximity to Port Klang (25–30 minutes), Subang Airport (15 minutes), and the upcoming LRT3 makes it the most accessible industrial location in Greater KL.
Supply is constrained. Shah Alam is a mature, fully developed industrial city. There are no greenfield sites left in Sections 15, 22, 23, or 26. New supply comes only through redevelopment (such as the LOGOS/SAILH project on the former CCM Chemicals site) — a slow, capital-intensive process. This supply constraint protects existing asset values.
Institutional validation. Maersk's APAC-largest warehouse, LOGOS's RM1.5B green logistics hub, Google Cloud's RM15B data centre investment at nearby Elmina, and Carlsberg's RM343M brewery upgrade confirm that institutional capital views Shah Alam as a premium industrial location. Institutional interest supports both pricing and tenant quality.
Rental growth trajectory. Sections 22, 23, 26, and 33 saw 8–10% rental growth in 2025. Analysts project 3–5% annual rental growth through 2027, supported by vacancy compression and infrastructure upgrades. Sarah's tenant renewal at +10% is consistent with this trend.
Price outlook. Industrial land in Shah Alam's core sections is projected to appreciate 5–8% annually over the next 3–5 years. With vacancy below 3% and new supply limited to redevelopment, the supply-demand balance strongly favours existing landlords.
Client Perspective
"I knew nothing about industrial property. IndustrialKL didn't just find me a property — they taught me how the market works. They showed me why my condos were underperforming and built a financial case for industrial that I could verify with real numbers. My factory in Shah Alam has been the best-performing asset in my portfolio for three years running. Zero vacancy, zero maintenance headaches, and a 46% total return. I'm now looking at a second industrial unit — this time in Jenjarom. I should have made this switch five years ago."
— Sarah, property investor, Kuala Lumpur
Key Takeaway
The residential-to-industrial switch is not about abandoning one asset class for another. It is about recognising that the Malaysian residential market — particularly condominiums in KL — has entered a structural period of yield compression, oversupply, and flat capital growth. For investors seeking income, capital appreciation, and low management effort, industrial property in Greater KL offers a fundamentally better risk-return profile.
The barriers to entry are not financial — they are informational. Most residential investors do not enter the industrial market because they do not understand it: how to assess a factory, what tenants look for, which areas are performing, and how industrial leases work. That knowledge gap is the real barrier, and it is exactly what advisory bridges.
Sarah's portfolio data tells the story: one factory outperformed three condos on every metric that matters — yield, appreciation, vacancy, income, and management effort. The numbers are not theoretical. They are real, auditable, and repeatable across Greater KL's industrial market.